Inspecting a Single Run
The monitoring views describe a FlowRunner™ flow in aggregate; this page is about one run: what did this run do with this data? Opening a run answers that block by block - what each one received, what it produced, and where things went wrong - whether you are chasing a failure or just confirming a run handled its data the way you meant.
Opening a run
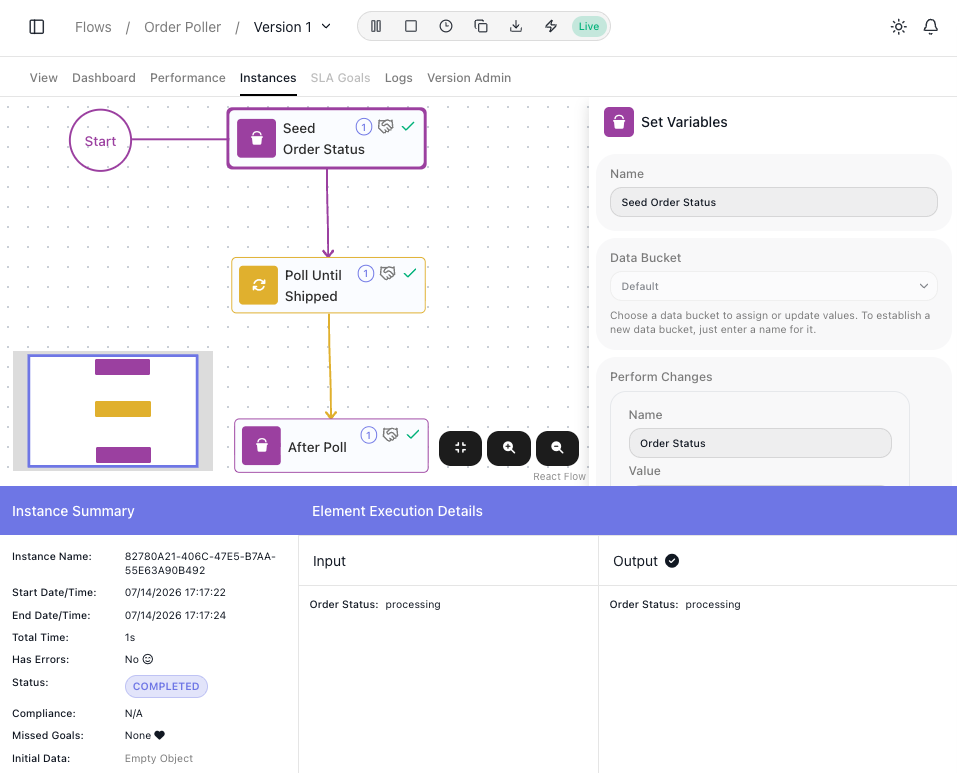
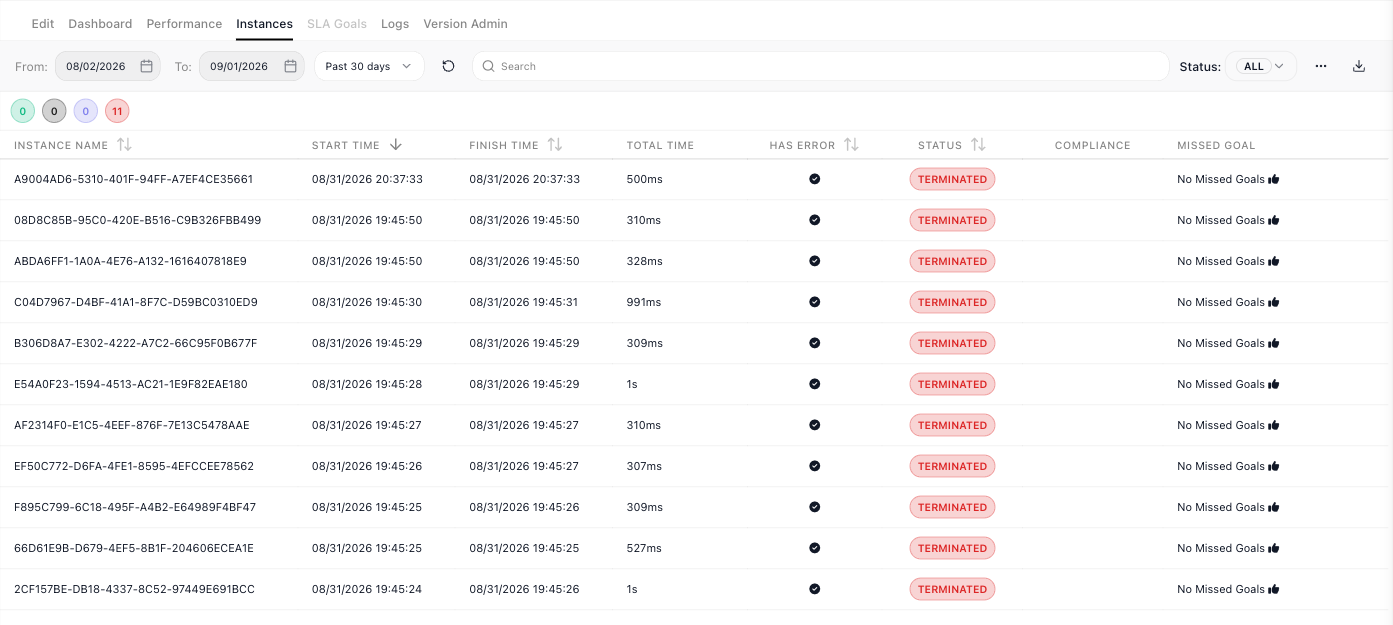
The Instances tab lists the flow's runs, each with its start and finish time, duration, error flag, and status, with filters above the list to narrow it.1 Open one and the flow is redrawn as that run took it: every block it executed carries a tick, and two panels carry the detail:
- Instance Summary - the run's facts: how long it took, whether it errored, which SLA goals it missed, and the Initial Data it started from.
- Select any block and Element Execution Details shows the Input it received and the Output it produced. That is how you follow a value from the data that arrived, watch each block reshape it, and pin the step where a wrong result first appears.
The example the shots follow is a flow that polls an order until it ships.
Finding the run you want
A row of coloured circles sits above the list, one per state, in this order: Running, Pending, Completed, Terminated. Each shows only a number, and hovering names it - "Terminated - 11 instances". Read them to answer "is anything stuck or dying right now?" without going through the table.
Clicking a circle filters the list to that state, and clicking it again clears the filter. The Status dropdown above sets the same filter, and the two always agree - filter by one and the other follows.
The counts follow the rest of the filter context - the date window, the search, and the two checkboxes behind the ... control, Only With SLA Violations and Only With Errors. The status filter itself does not narrow them, because the circles are the status overview.
Taking the list away as CSV
The download icon beside the filters - its tooltip reads Export instances to CSV - writes a CSV of everything matching the current filters, not just the page you are looking at. Set the filters you want first, then export: what the list is showing, including every page it would take you through, is what the file holds.
One row per run, with a column for the instance name, the execution id, the flow name and version, the status, the start and finish times, the total time in milliseconds, the error flag and handled-error detail, and the SLA compliance and missed goals. The execution id is kept as its own column even when a run has a friendly name, so an exported row still lines up with the API and with a support conversation.
The export runs on the server rather than in the page, so a large result does not block you - you can keep working or leave the screen. The finished file is delivered by a link sent to the address on your account.

Stepping through a loop's passes
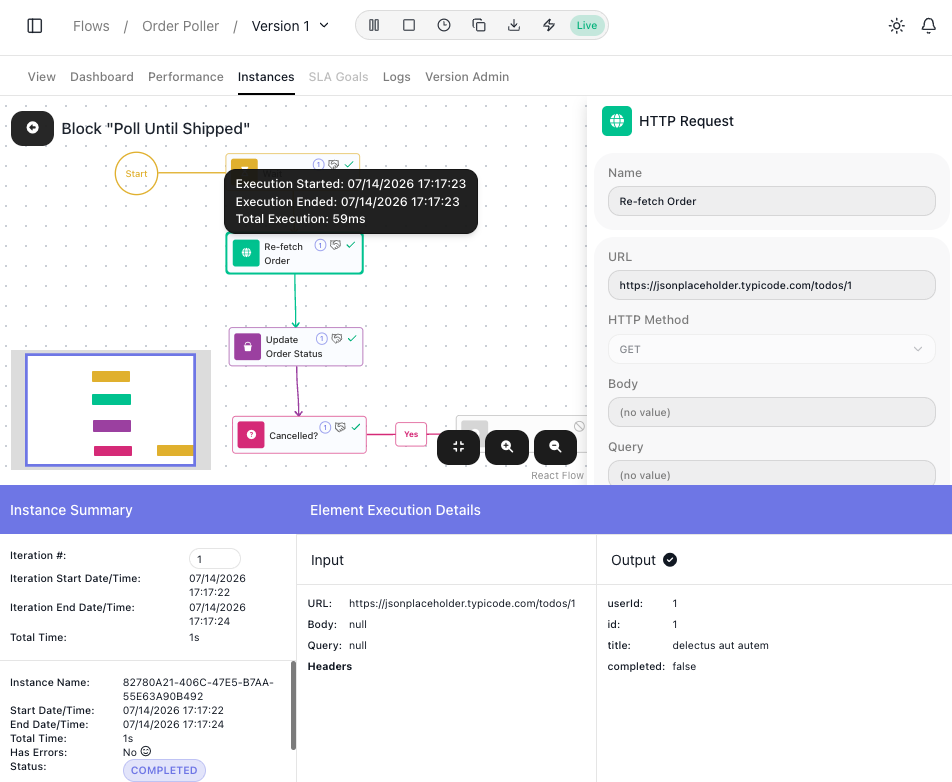
A Repeat or List Iterator runs the same inner steps many times, and a bug usually lives in one pass. Hover the loop block and click the expand icon that appears on it. The loop's inner blocks are drawn with their own markers: a tick on each block the pass executed, a not-executed marker on any branch it skipped. The Iteration # field then walks the run pass by pass - jump to the one iteration of forty where a value went wrong and inspect every block on that pass. RETURN, at the top left, steps back out to the whole flow.
Checking a block's retry attempts
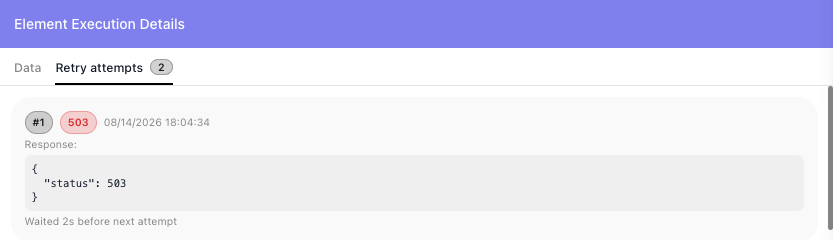
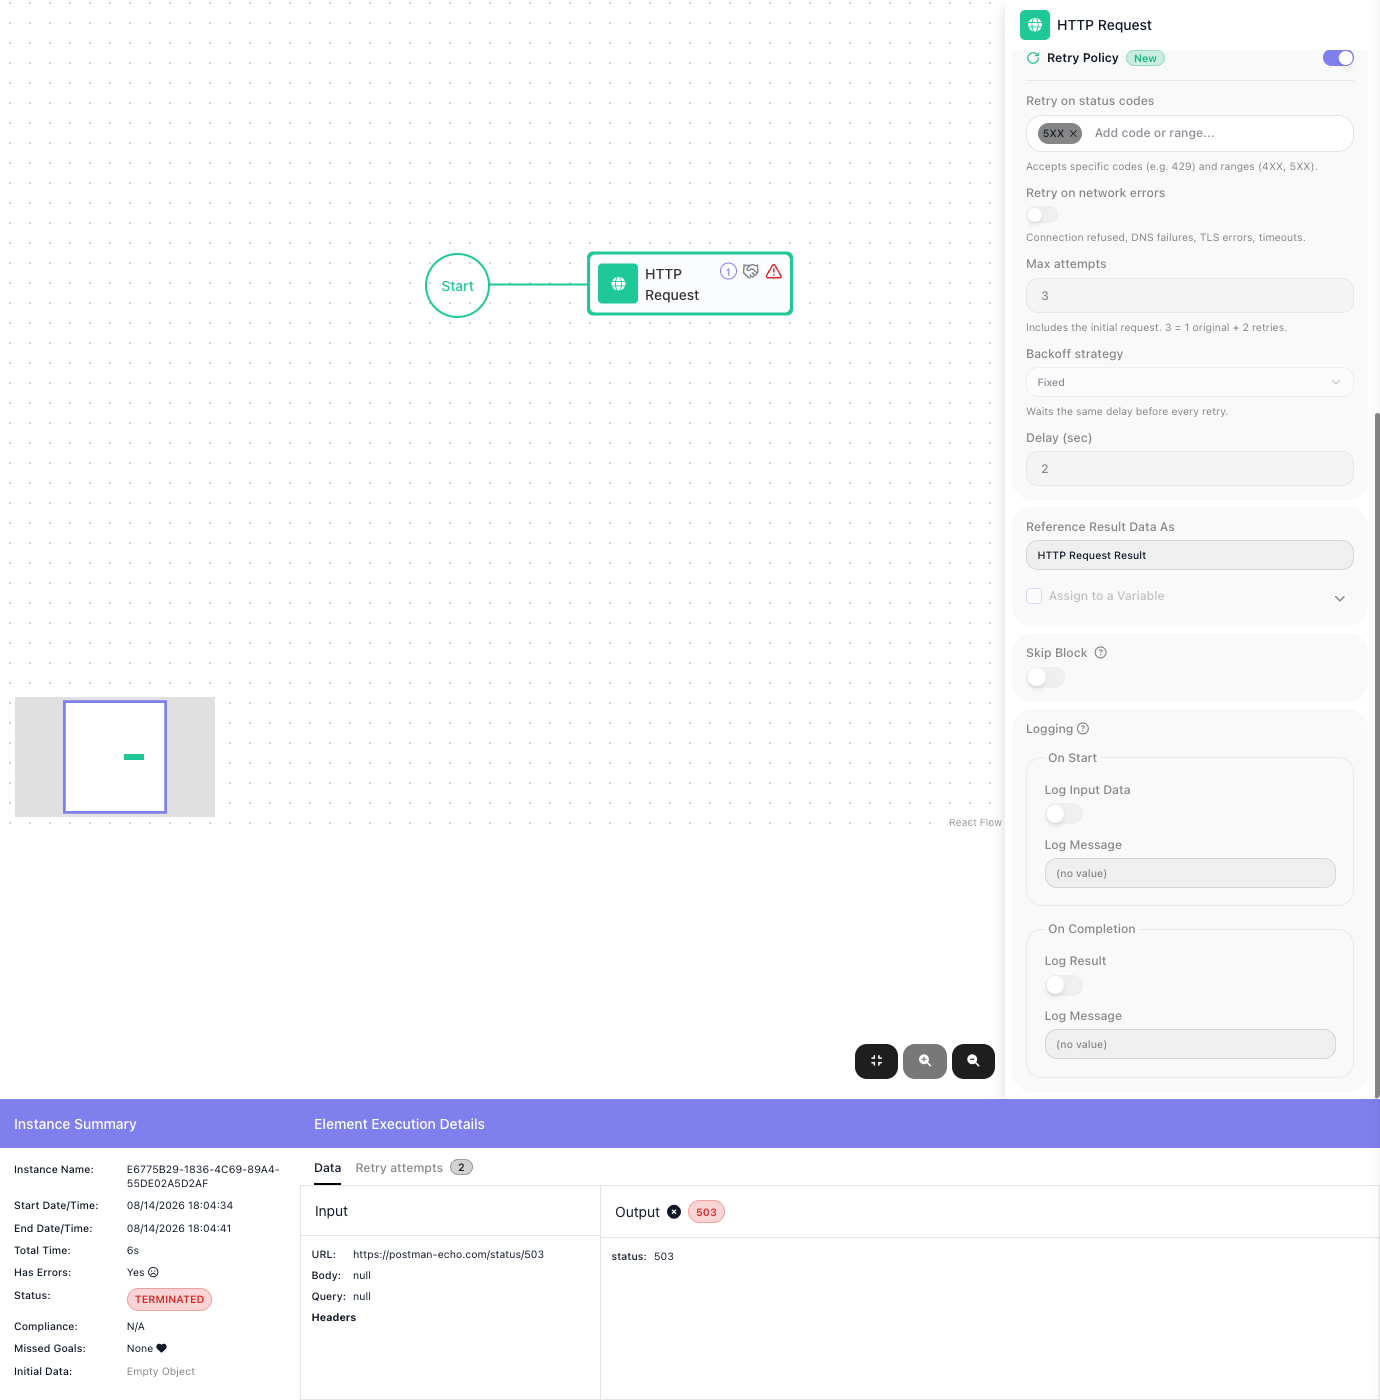
Retry attempts show you whether a Retry Policy is doing its job. Retries need a call that fails, so this section follows a second flow - one whose HTTP Request calls an endpoint that answers 503. When the block's policy fired during a run, its Element Execution Details grows a second tab, Retry attempts, with one entry per failed attempt that triggered another try; the final attempt's outcome, success or failure, stays on the Data tab, so a policy that exhausted three attempts shows two entries here. Each entry carries:
- the attempt number, and when it ran,
- what it failed on, and the response the service actually sent,
- how long the run waited before the next try.
A couple of 503s followed by a success is a transient fault the policy absorbed; every attempt failing the same way means the retries are being spent on an error that will never pass.
Finding the step that failed
A failed run arrives flagged everywhere you might look for it. In the Instances list, its row is marked TERMINATED with its Has Error column filled - and the Only With Errors filter above the list finds such runs fast.

The same run lands in the Dashboard's Problematic Instances shortlist, where clicking the row opens it:

Open it and the trail continues: the Instance Summary reads Has Errors: Yes, and on the redrawn flow the block that broke carries a warning marker where the others carry ticks. Select it and its Output holds what the failure returned - for the retried call above, the 503 status the service kept answering with. From a run marked in the list, you are two clicks from the exact step that failed and what it answered.
Related
- Monitoring & Analytics - the flow in aggregate: Dashboard, Performance, and Logs
- Running Flows - taking a flow live, and the run list this page opens from
- Handling Errors - designing the recovery paths a failed run points you toward
- Flows and Instances - the flow-and-run model behind every run here