Monitoring & Analytics
A live flow runs on its own - monitoring is how you know it is doing what you built it for, and where to look the moment it isn't. Four views answer four questions: the Dashboard - what is going on with the flow, and is anything wrong? Performance - which step is slow, or starting to fail? Logs - what happened, step by step, on a run you need to trace? And opening a single Instance - what did that one run do with its data? How far back any of them can look is set by your workspace billing plan - the history reaches only as far as the plan's audit-trail retention.
Dashboard - the flow at a glance
Open the Dashboard to take in the whole flow at once and catch trouble before you go digging. The headline numbers answer "is anything wrong?":
- Completion Rate and Error Rate - are runs succeeding? A rising Error Rate is your cue to open the Logs or the failing runs.
- Active Instances - how many runs are in flight right now. A count that keeps climbing means runs are starting faster than they finish, and a backlog is building.
- Total Runs - the volume over the range, so you can watch load rise or fall.
- SLA Compliance - whether runs are hitting the time targets you set as SLA goals. This carries real data on the Business and Enterprise plans, where SLA tracking lives.
Below the numbers is where you make sense of what the flow is doing:
- Run history charts when the flow actually ran, as a heatmap of daily activity. A quiet stretch that should have been busy points at a schedule that stopped; a burst points at a caller gone wild. Click a day to list its runs - each with its time, what started it, and how it ended - so an odd-looking day is one click from the runs behind it. When a flow has more than one version, the Versions list lets you tick which versions to include, to read a new version's behaviour on its own or next to the old one.
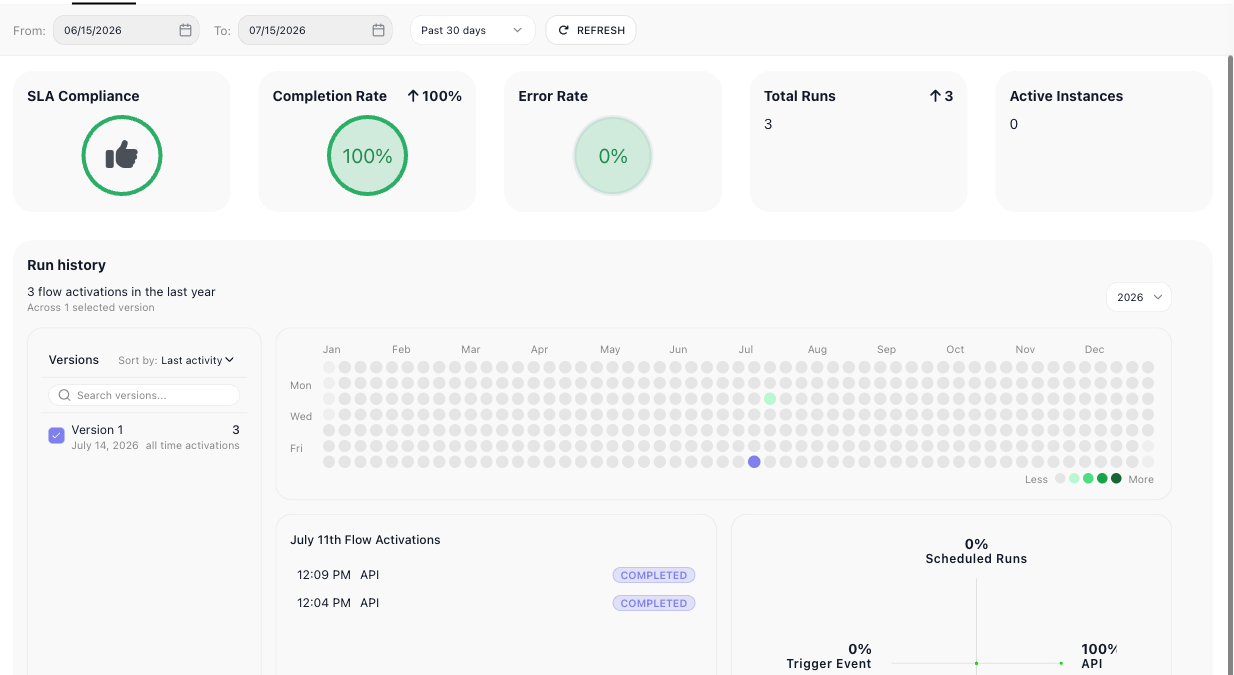
- Execution sources - what is starting your runs: a schedule, an API call, a trigger. This is how you tell a steady scheduled job from an API flood, or notice a trigger firing when nothing should be triggering it.
- Block Transitions - which paths the runs actually took, drawn onto the flow. A branch that never fires, or one that fires far more often than you expected, stands out against the diagram.
- Problematic Instances - the shortlist worth your attention: the runs that errored or missed an SLA goal, ready to open.
Performance - where the time goes
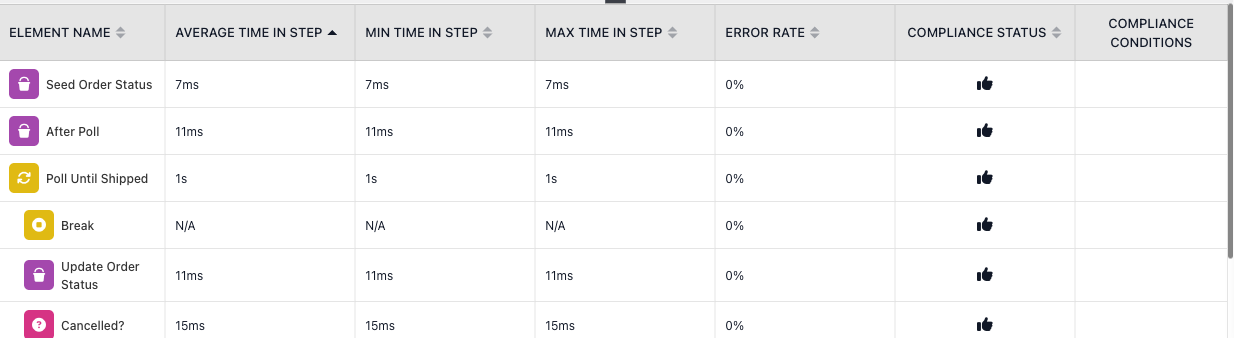
When a flow feels slow, Performance tells you which step to blame. It times every block across the runs in range - Average, Min, and Max time spent in that step - beside its Error Rate and SLA Compliance. Sort by average time to bring the bottleneck to the top, or by error rate to surface a step that is quietly failing. A block whose max time towers over its average is one that stalls on certain inputs and not others - the kind of intermittent slowness that is hard to catch any other way.
Logs - the play-by-play
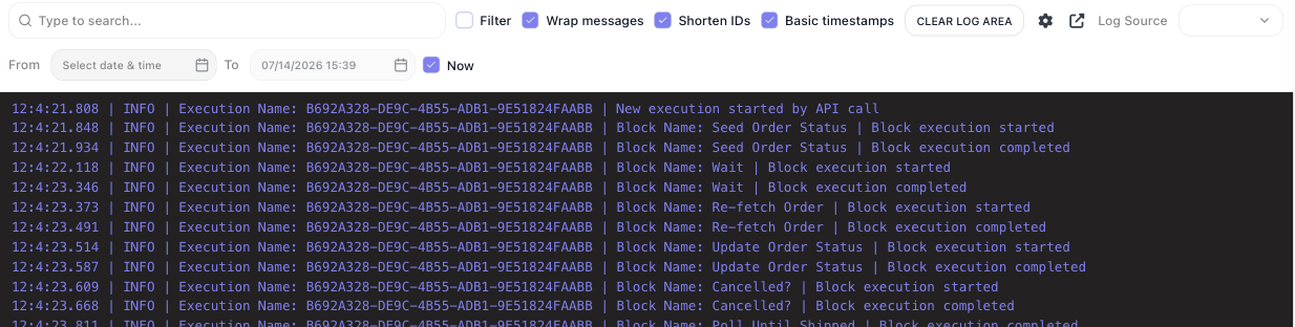
When you need the actual sequence of events rather than the averages, the Logs tab is the raw record: every run, and every block within it, timestamped as it starts and completes, tagged with how the run began. It is where you reconstruct a specific run or pin down the moment one went wrong. Filter to a single run or to errors, and use the toggles to wrap long lines or drop the ids when you just want to read the flow of events.
Reading a single run
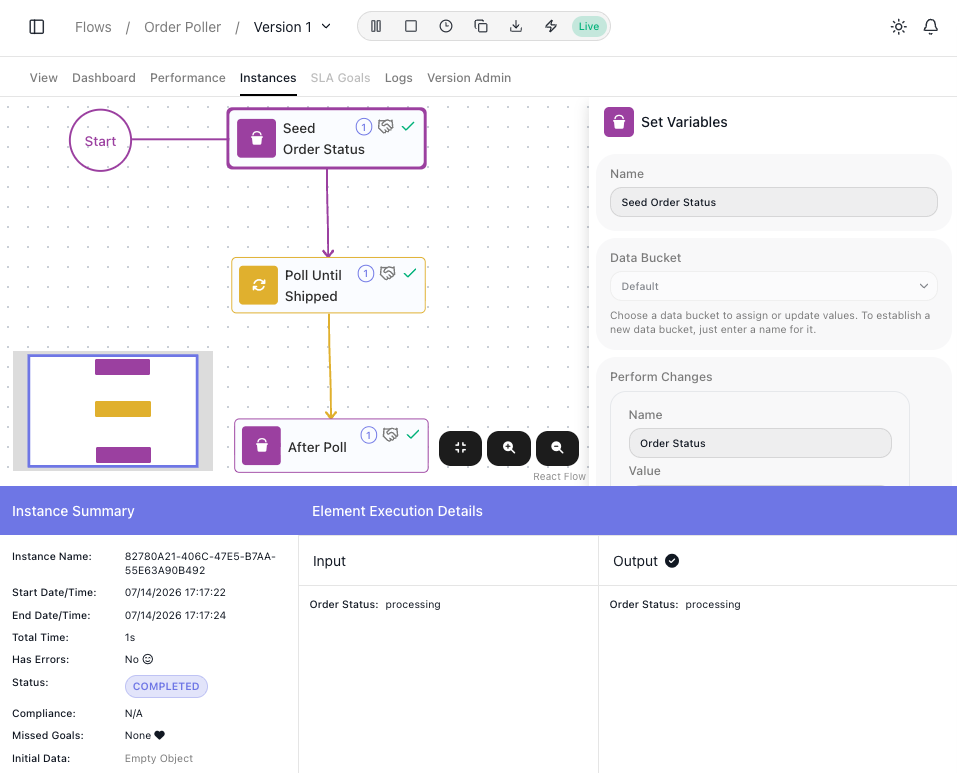
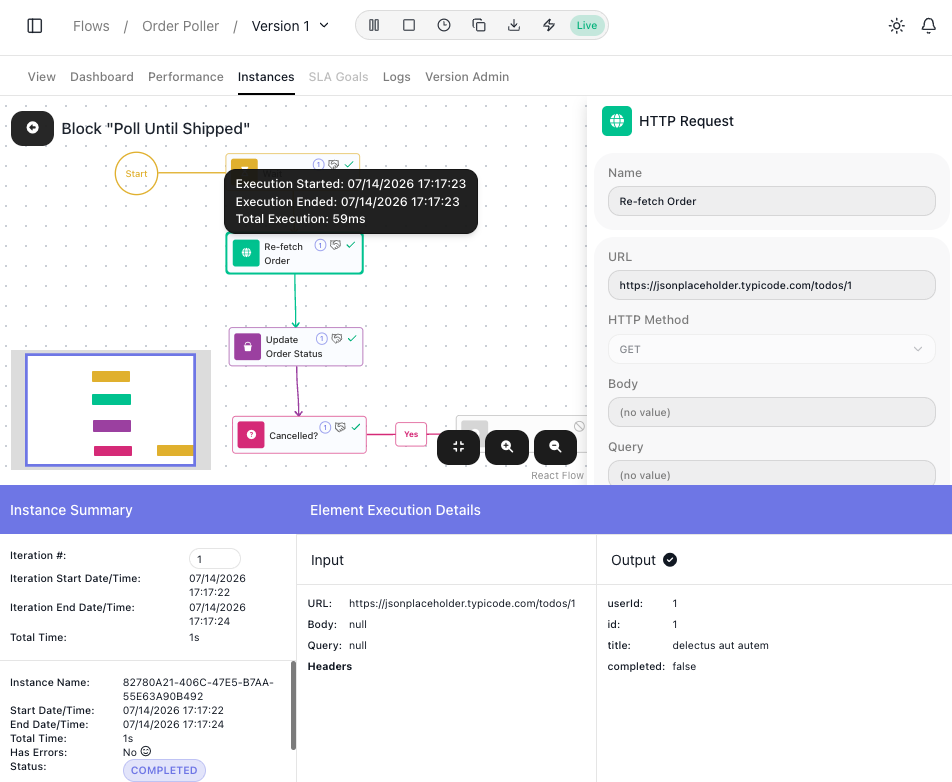
The tabs above describe the flow in aggregate; to answer "what did this run do with this data", open a run from the Instances tab. The flow is redrawn as that run took it - every block it executed is ticked, so a wrong branch or a skipped step is obvious at sight - and two panels carry the detail:
- Instance Summary - the run's facts: how long it took, whether it errored, which SLA goals it missed, and the Initial Data it started from.
- Select any block and Element Execution Details shows the Input it received and the Output it produced. That is how you follow a value from the data that arrived, watch each block reshape it, and pin the step where a wrong result first appears.
Loops. A Repeat or List Iterator runs the same inner steps many times, and a bug usually lives in one pass. Its expand icon steps into the loop, and the Iteration # field walks the run pass by pass - so you can jump to the one iteration of forty where a value went wrong and inspect every block on that pass. RETURN steps back out.
Errors. A failed run flags the error in its Instance Summary, and the block that broke carries the message in its Output - so a run marked with an error in the list takes you, in a couple of clicks, to the exact step that failed and why.
Related
- Running Flows - taking a flow live, and the run list these views draw on
- SLA Goals - the time targets that SLA Compliance measures against
- Flows and Instances - the flow-and-run model behind every number here
- Billing - what the runs behind these numbers cost, and how far back the history reaches